Risk adjusted underwriting returns
Insurers can improve their capital allocation by applying lessons from successful CEOs in other industries.
The Outsiders
In his book, The Outsiders: Eight Unconventional CEOs and Their Radically Rational Blueprint for Success, William Thorndike, Jr. profiles eight CEOs whose track record, as measured by total stock price return, far exceeded the performance of the overall market and their peer groups. Even though the CEOs were from different industries and eras, Thorndike noticed several common traits among the CEOs. The strongest thread tying them together was their single-minded focus on appropriately allocating capital. Thorndike writes, “These executives were capital surgeons, consistently directing available capital toward the most efficient, highest-returning projects. Over long periods of time, this discipline had an enormous impact on shareholder value.” They recognized their primary job was as stewards of the capital that shareholders had entrusted to them. In summarizing how the CEOs achieved this objective, Thorndike provides a checklist framework for making effective resource allocation decisions. The rest of this article will focus on two of the initial items from this checklist and apply the framework to an insurance example.
Target hurdle rate
Start by determining the hurdle rate—the minimum acceptable return for investment projects
In order to allocate capital effectively, we must have a yardstick to measure against. This “hurdle rate” should be determined relative to the set of opportunities available to the company. Often the hurdle rate is set equal to the company’s weighted average cost of capital (WACC). Currently, the WACC for publicly traded P&C (re)insurers is around 8% using the Capital Asset Pricing Model (CAPM). For mutual insurers, the cost of capital is more difficult to estimate since they do not have to achieve a return that satisfies equity-holders’ expectations. Surplus notes do provide a reference point for the cost of debt capital which can be used alongside traditional metrics for publicly traded companies to estimate a mutual insurer cost of capital.
insurers is in the range of 8-12%.
Risk-adjusted returns
Calculate returns for all internal and external investment alternatives, and rank them by return and risk
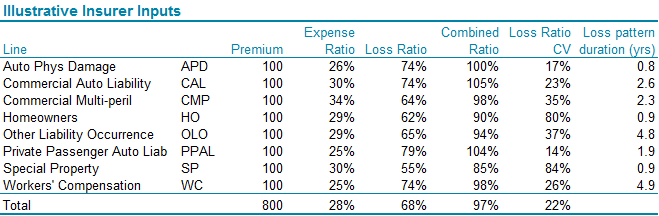
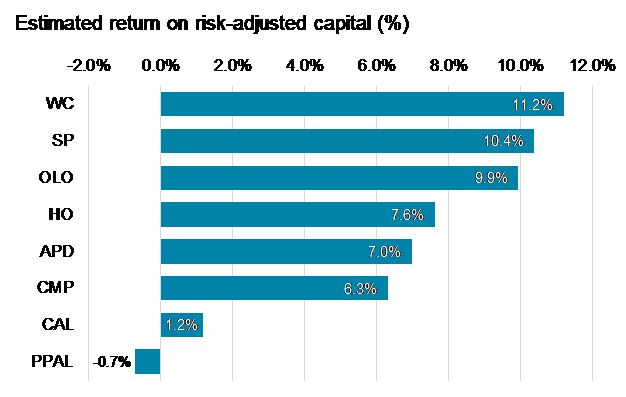
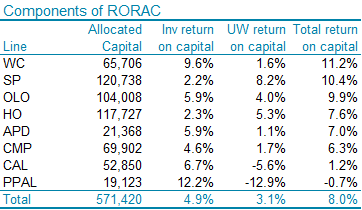
Once a hurdle rate is determined, we can estimate the risk-adjusted returns for our investment opportunities - here, illustrated using underwriting operations. To do this we estimate a return on risk-adjusted capital (RORAC) by line for a hypothetical US company writing eight lines of business, each with premium volume of USD 100 million.
Return
The numerator of the RORAC calculation is the total income generated from a given line of business. This includes the underwriting income plus investment income earned on both policyholder supplied funds and the capital supporting the line. Here we use a three year average of the median combined ratio by line of business from US Annual Statement data by company to develop the expected underwriting inputs. For simplicity, the investment return is assumed to be a constant 2%.
Capital
The outsider CEOs believed that the value of financial projections was determined by the quality of the assumptions, not by the number of pages in the presentation
Estimating required capital by insurance line of business is an inherently paradoxical exercise - in reality every dollar of insurer capital sits behind every policy. Yet to make informed investment decisions we need to estimate what each unit contributes to the overall capital need. This exercise has an extensive body of actuarial literature, but here we will take a practical approach focusing on the key assumptions.
The capital required to support a line of business is a function of four interrelated elements: premium volume, volatility, duration of loss payout, and correlation to other risks.
- Premium volume: The premium volume sets the absolute scale of each line. In addition, both volatility and correlation vary by premium volume.
- Volatility: This is the primary driver of standalone required capital. The more volatile a line of business, the more capital needed to support it. The Companion Volume of the report measures underwriting volatility as the coefficient of variation (CV) of historical loss ratios. This reflects the realized volatility observed through time by line of business. Volatility is a function of many underlying factors including: size of book of business, policy limits, industry classes, geography, and catastrophe exposure. Here we use the CVs for US lines provided in the Companion Volume. Note that since these CVs are based entirely on historical data, we are not using output from a vendor catastrophe model for property lines. This will understate the true volatility of property lines.
- Duration of loss payout: After we have written a risk, we need to hold capital for that risk until its losses are fully paid. Up until that point, there is still a risk that we will have to pay more in losses than we anticipated. This is what is known as loss reserve risk. To reflect reserve risk in our capital estimates we adjust the loss cash flows to reflect the length of the payout pattern, which we estimate by line from historical loss triangles.
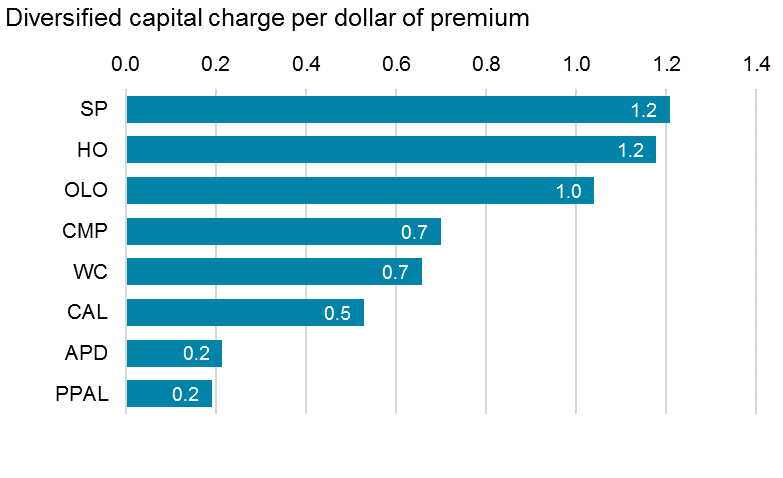
- Correlation: Correlation reflects the relationship between the modeled loss ratios by line. Similar to volatility, many underlying factors influence the correlation of loss ratios. Correlation estimates require large amounts of data to be credible, underscoring the value of the benchmark correlation matrices. The diversification benefit we achieve is determined by the level of correlation assumed across lines.
For illustration purposes, we assume a lognormal distribution for loss ratios and use the 99.5% (200 year) value-at-risk (VaR) measure for required capital.
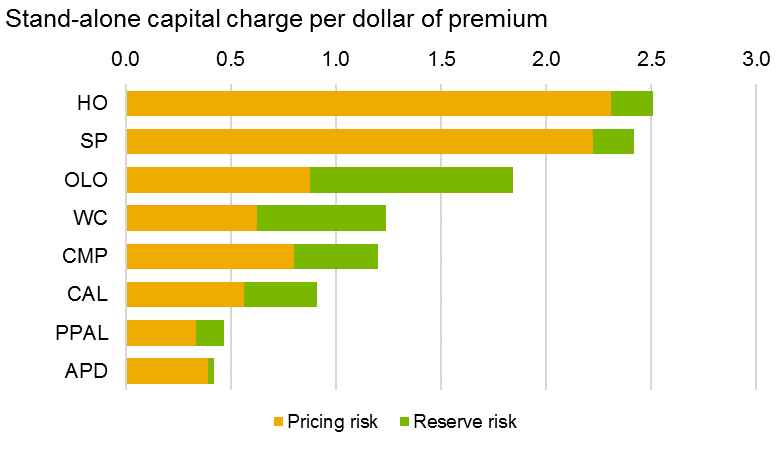
The volatility of the property lines show through indicated by their high capital charge per dollar of premium. They have the highest pricing risk of all the lines. The long tail nature of Other Liability Occurrence and Workers’ Compensation are reflected in the larger amount of reserve risk. The private passenger auto lines have lower risk and thus the lowest capital requirements.
Return over capital
Now we can combine the return and capital amounts to estimate return on risk-adjusted capital by line. For our illustrative insurer, Workers’ Compensation, Special Property, and Other Liability Occurrence achieve a return greater than our estimated hurdle rate - lines to grow in. For the lines that do not meet our hurdle rate, we can take actions to improve the returns through pricing increases or reducing required capital, such as by purchasing additional reinsurance.
(Re)insurers do not have an easy task in following the example of The Outsider CEOs. By its nature insurance underwriting returns are difficult to risk adjust - we don’t know the true cost of goods at the time of purchase. However, the framework outlined in this article, along with the information in the Companion Volume, provide a foundation for helping all executives to be effective “capital surgeons.”