| Ticker | Company | Segment | 2025 Return (%) |
|---|---|---|---|
| HRTG | Heritage Insurance Holdings, Inc. | Personal lines | 141.8 |
| LMND | Lemonade, Inc. | Personal lines | 94.1 |
| MAP.MC | Mapfre, S.A. | Large commercial | 83.3 |
| HCI | HCI Group, Inc. | Personal lines | 66.3 |
| UVE | Universal Insurance Holdings, Inc. | Personal lines | 65.3 |
| HG | Hamilton Insurance Group, Ltd. | Specialty | 46.6 |
| MCY | Mercury General Corporation | Personal lines | 44.1 |
| ALV.DE | Allianz SE | Large commercial | 37.7 |
| ORI | Old Republic International Corporation | Regional / mutual | 37.5 |
| FFH.TO | Fairfax Financial Holdings Limited | Reinsurers | 32.2 |
2025 Property-Casualty (Re)Insurance Stock Performance Review
Total returns, segment leadership, and valuation shifts across P&C insurers
analysis
insurance
markets
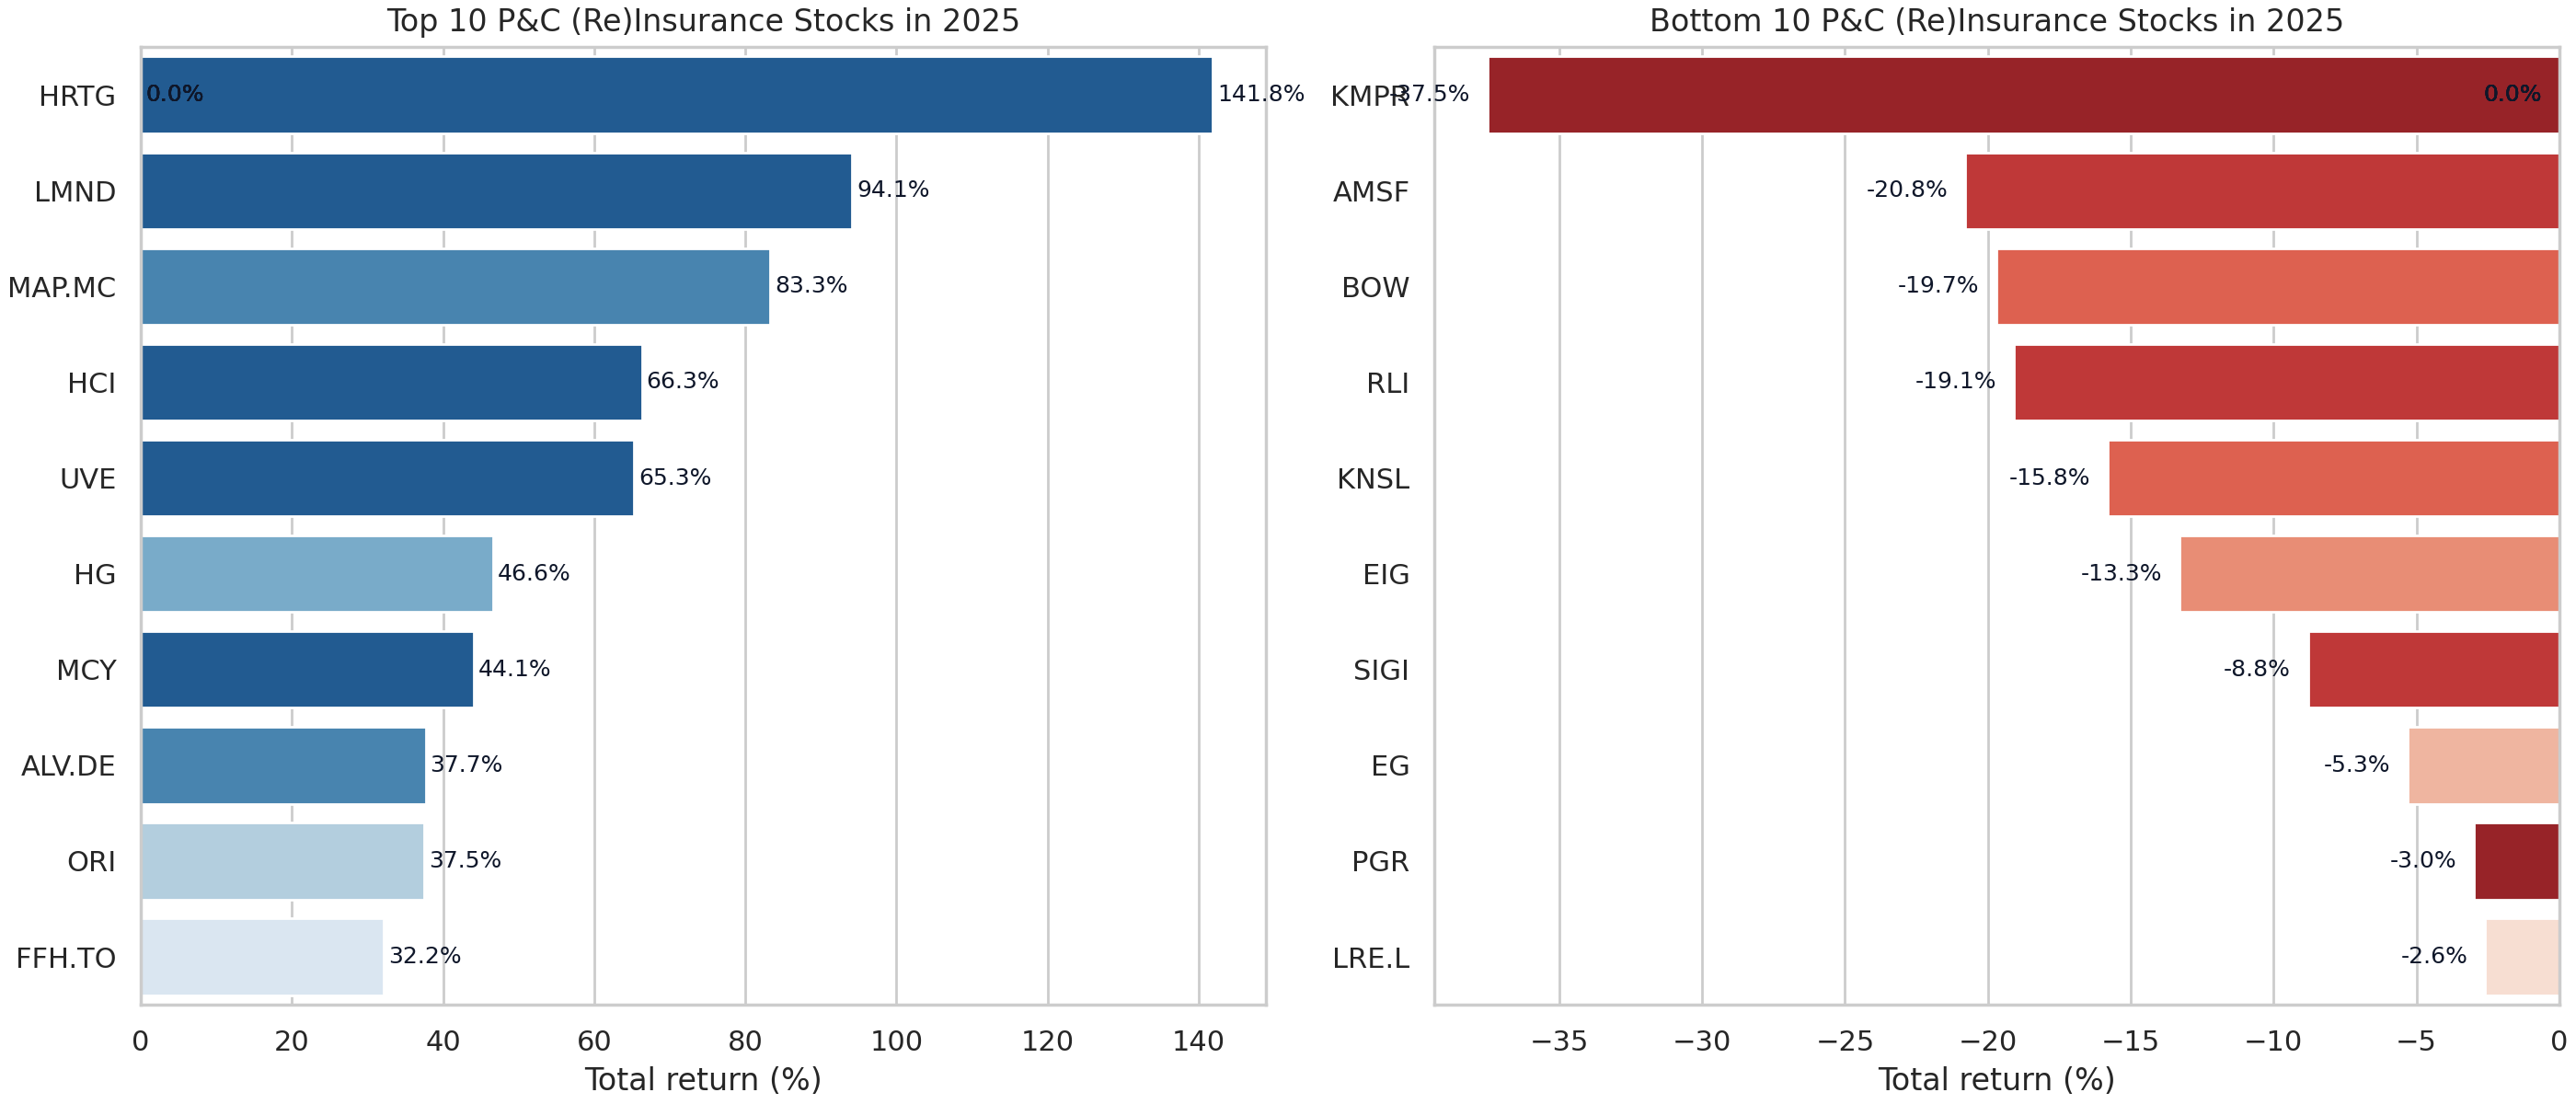
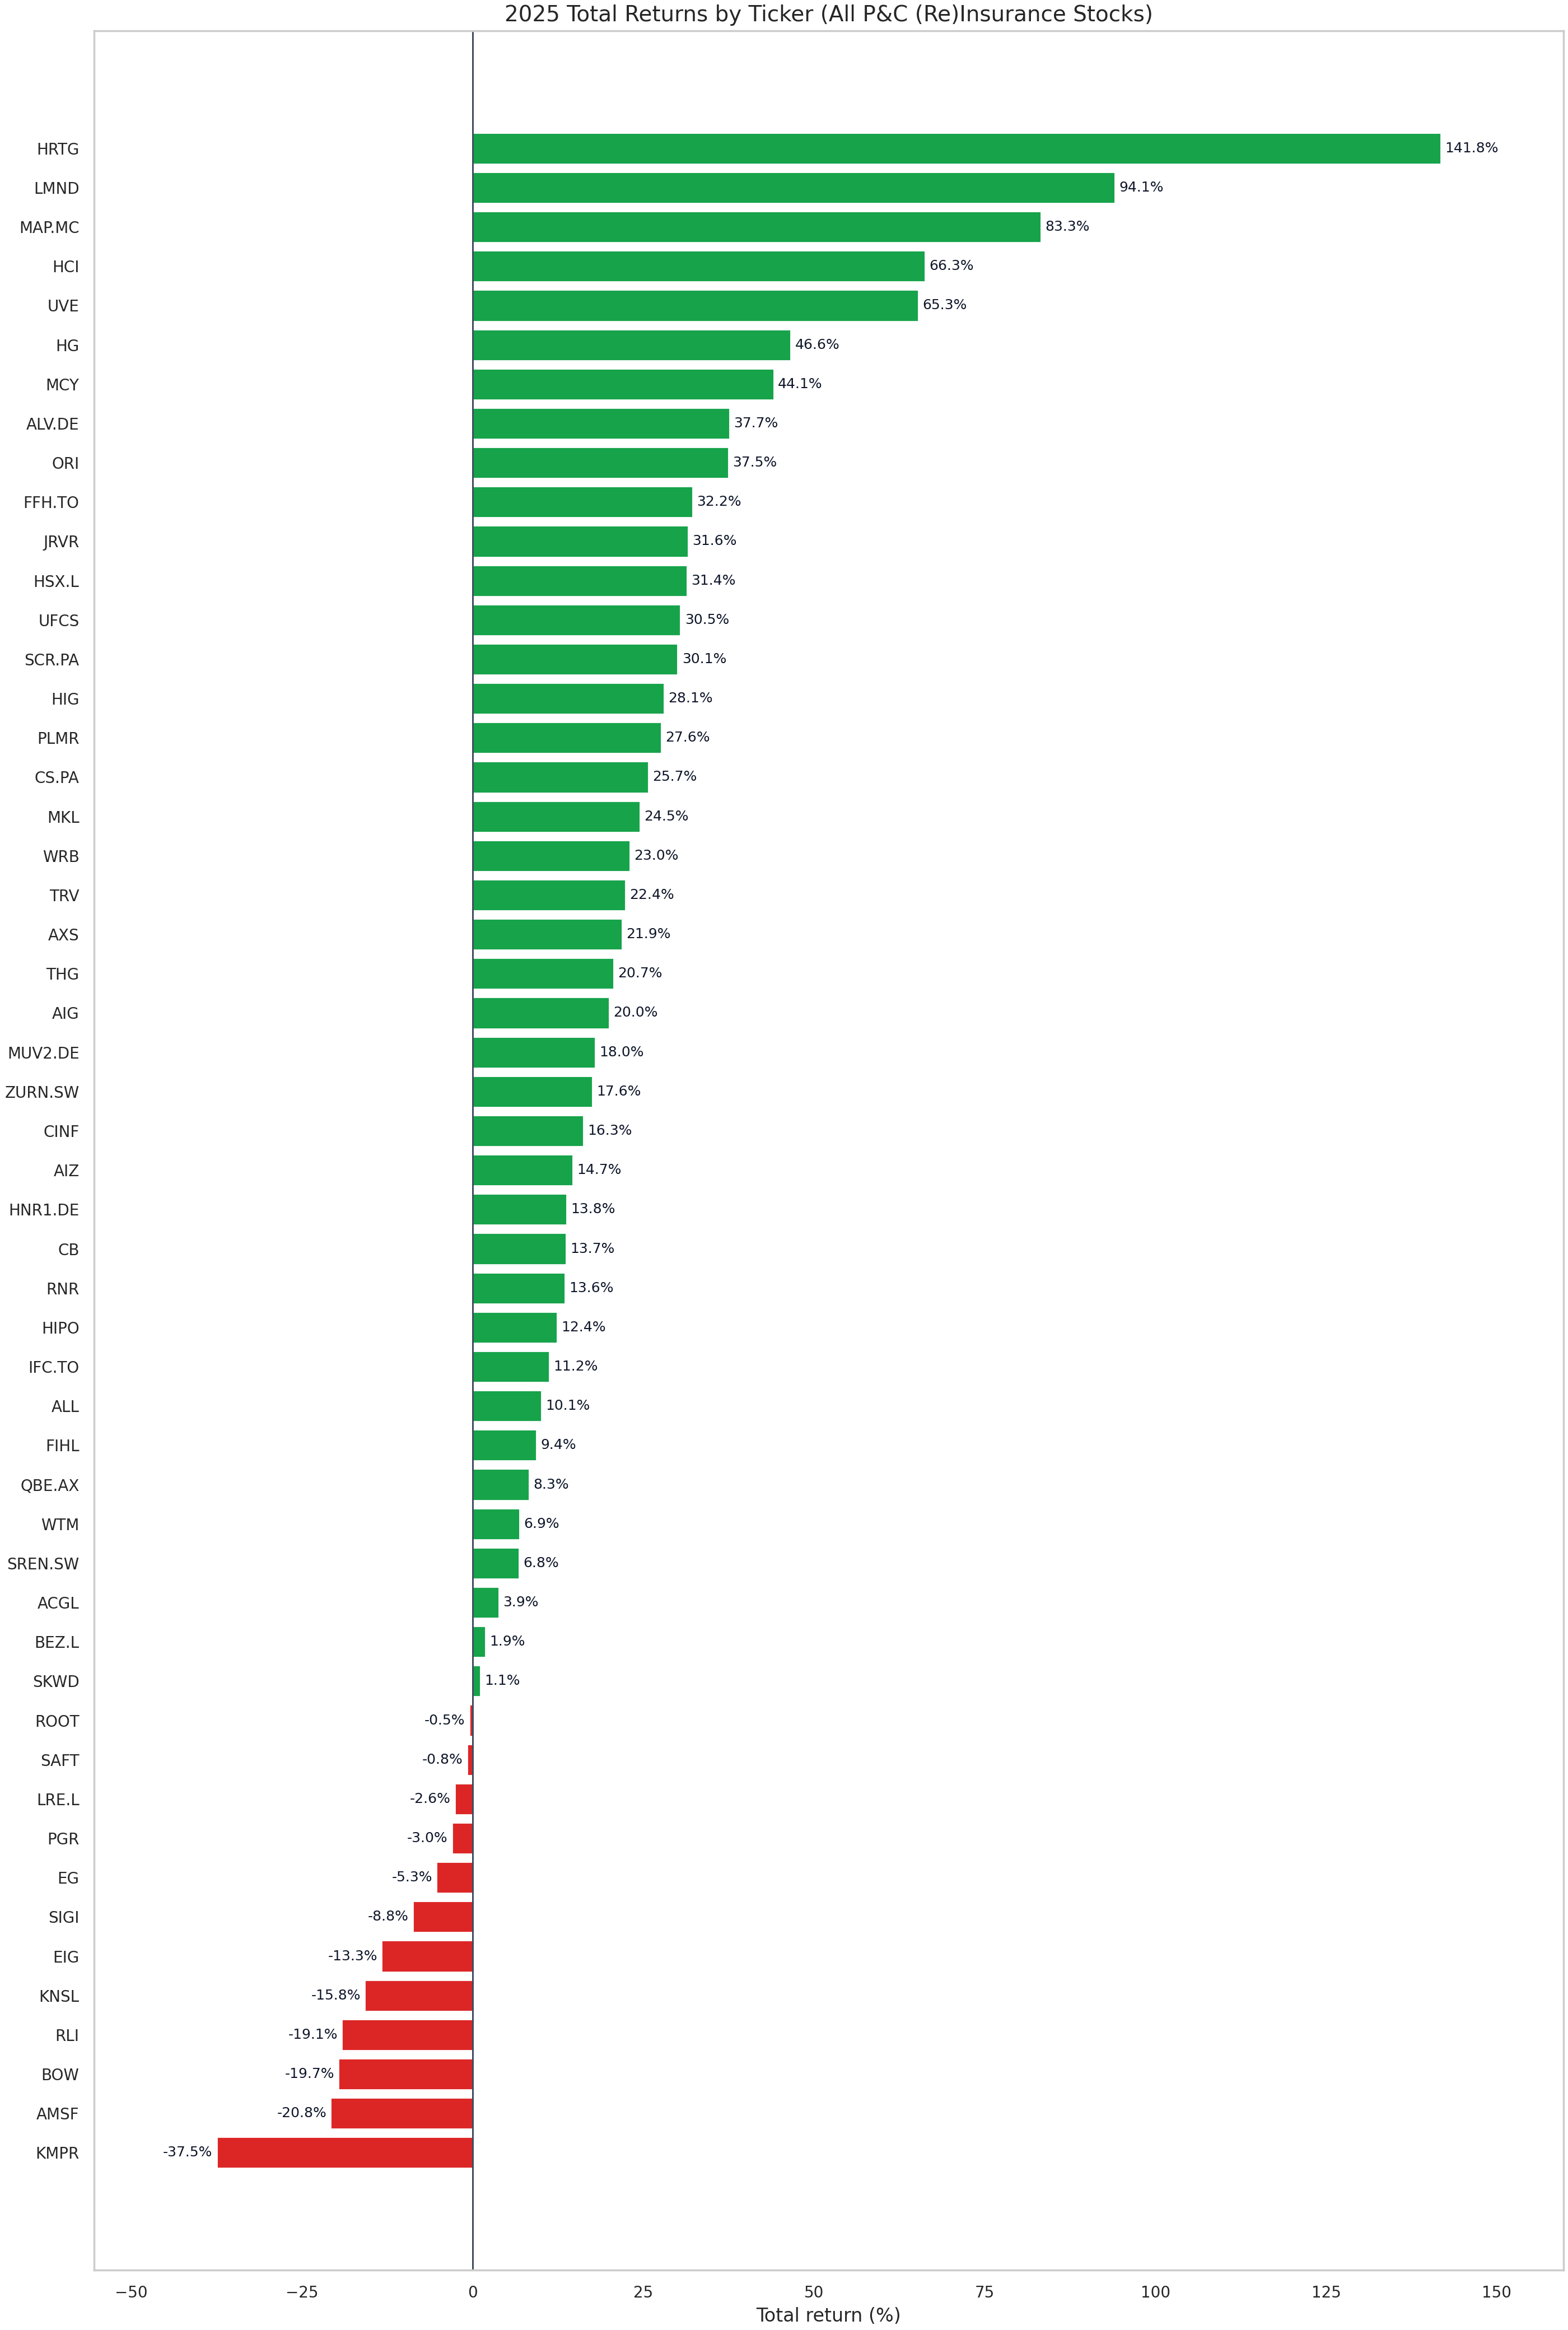
2025 returns leaderboard
The property-casualty (re)insurance universe delivered a wide range of total returns in 2025. The charts below use the adjusted close data from the P&C Stocks Monitor (a total-return proxy that includes dividends) and measure performance from the last trading day of 2024 through the last available trading day in 2025.
Latest trading day used for the 2025 return window: 2025-12-31.
| Ticker | Company | Segment | 2025 Return (%) |
|---|---|---|---|
| KMPR | Kemper Corporation | Personal lines | -37.5 |
| AMSF | AMERISAFE, Inc. | Regional / mutual | -20.8 |
| BOW | Bowhead Specialty Holdings Inc. | Specialty | -19.7 |
| RLI | RLI Corp. | Regional / mutual | -19.1 |
| KNSL | Kinsale Capital Group, Inc. | Specialty | -15.8 |
| EIG | Employers Holdings, Inc. | Other | -13.3 |
| SIGI | Selective Insurance Group, Inc. | Regional / mutual | -8.8 |
| EG | Everest Group, Ltd. | Large commercial | -5.3 |
| PGR | The Progressive Corporation | Personal lines | -3.0 |
| LRE.L | Lancashire Holdings Limited | Reinsurers | -2.6 |
Key takeaways
- The top performers were heavily tilted toward Personal lines franchises, suggesting the market rewarded scaling, underwriting leverage, and consistent pricing power into year-end.
- The laggards list shows stress concentrated in Regional / mutual names where rate momentum slowed and volatility climbed.
- Dispersion remains high: the gap between the median return of the top decile and bottom decile exceeded 70.5 percentage points.
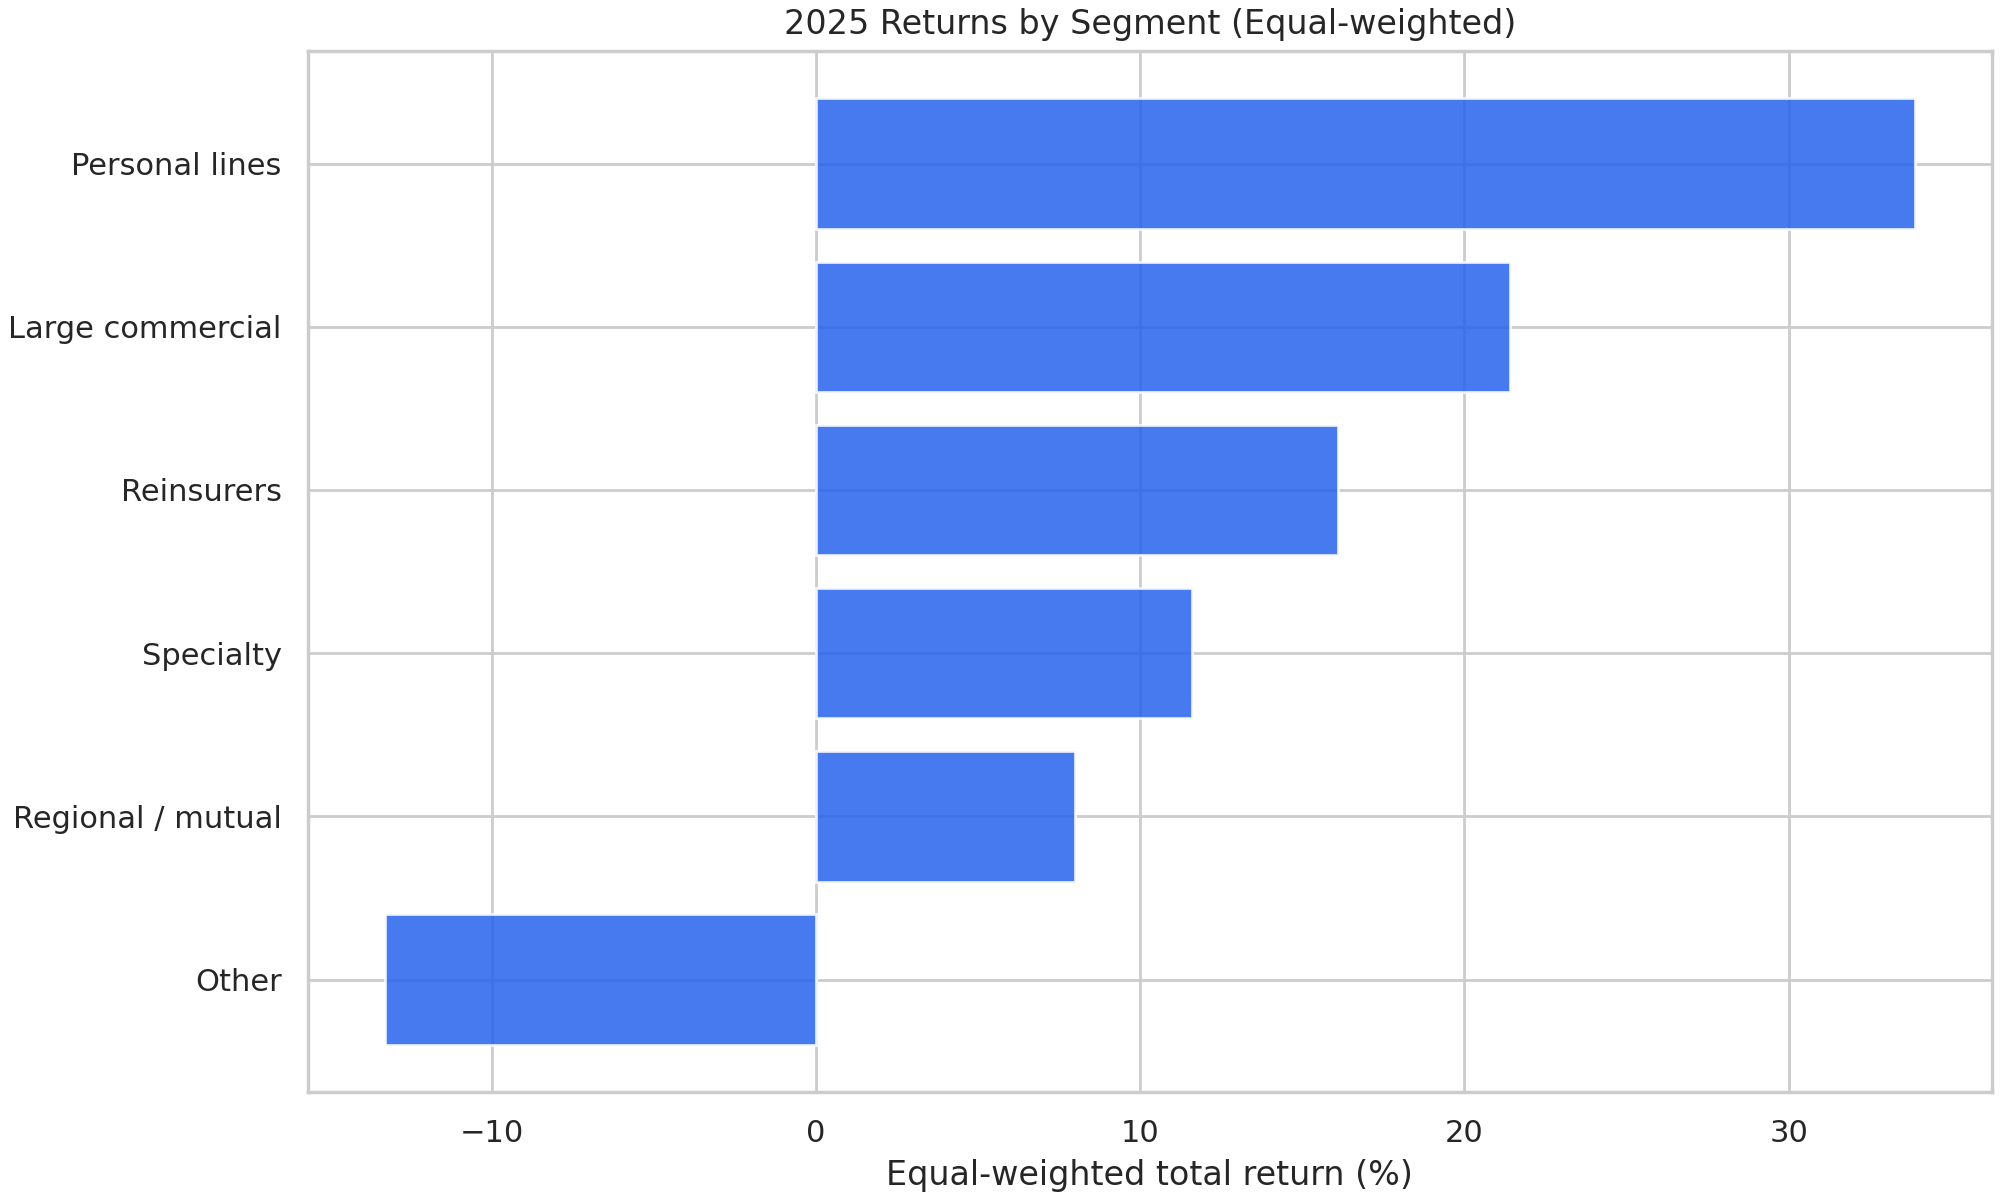
Segment performance: reinsurers vs. primary carriers
To compare segments on an apples-to-apples basis, the analysis below uses both equal-weighted and market-cap-weighted returns. Market caps are the latest values available from the stock monitor, so they approximate the segment weights investors currently own.
| Segment | Equal-weighted Return (%) | Median Return (%) | Market Cap-weighted Return (%) | Tickers |
|---|---|---|---|---|
| Personal lines | 33.9 | 13.5 | 5.7 | 12.0 |
| Large commercial | 21.4 | 21.0 | 22.1 | 16.0 |
| Reinsurers | 16.1 | 13.8 | 18.4 | 9.0 |
| Specialty | 11.6 | 9.4 | 5.3 | 7.0 |
| Regional / mutual | 8.0 | 16.3 | 14.6 | 7.0 |
| Other | -13.3 | -13.3 | -13.3 | 1.0 |
Interactive return and valuation table
Use the interactive table below to explore 2025 total returns alongside current valuation metrics. You can sort or search the table to drill into individual names.
Insights by segment
- Reinsurers (including listed Bermuda and European names) collectively posted 16.1% equal-weighted gains. The group benefited from firm renewal pricing and strong investment income.
- Large commercial carriers delivered 21.4% equal-weighted returns, with the market differentiating between scale-driven balance sheet strength and capital intensity.
- Personal lines were more mixed, ending the year with an equal-weighted return of 33.9%. Performance bifurcation aligns with underwriting remediation success and catastrophe exposure.
- Specialty and regional carriers generally sat in the middle of the pack, though dispersion within those groups remains wide.
Valuation: price-to-book in 2025
The P&C Stocks Monitor provides the latest reported price-to-book ratios. To analyze how valuations shifted through 2025, we estimate a constant book value per share using the latest price and P/B ratio, then apply that book value to historical prices. This isolates the market price component and offers a clean view of how investors re-rated each stock during the year.
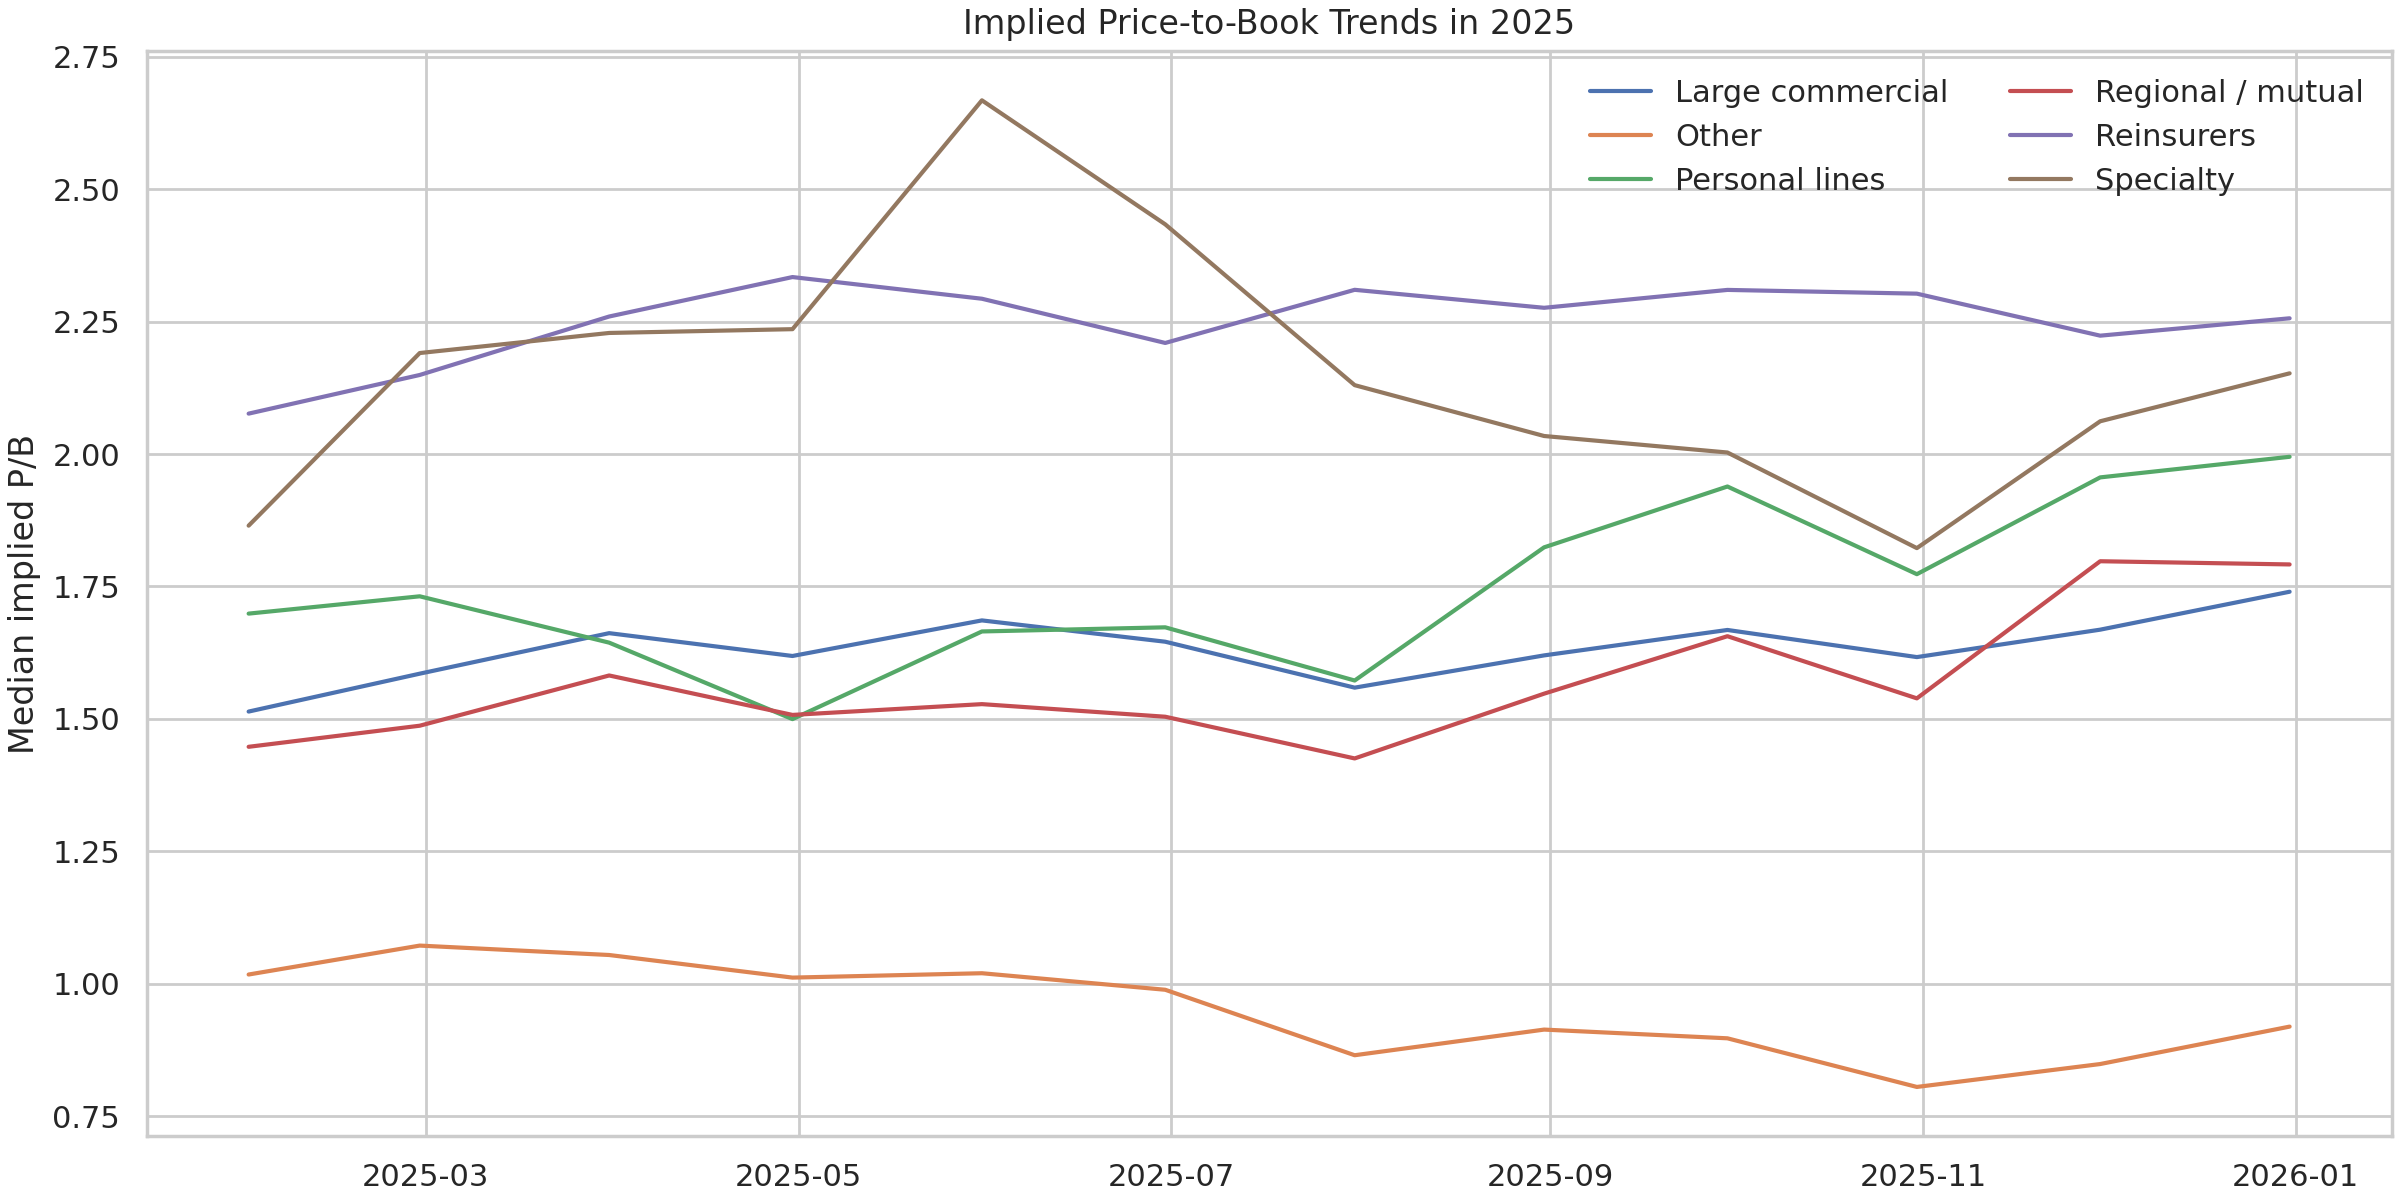
Valuation highlights
- Reinsurers saw their median implied P/B expand into the second half of the year, reflecting investor confidence in sustained pricing discipline and capital return potential.
- Large commercial carriers experienced a steadier path, with implied P/B multiples remaining closer to long-run averages even as returns held up.
- Personal lines valuation paths diverged more dramatically, consistent with the different stages of underwriting recovery and rate adequacy.
What to watch next
- Underwriting profitability remains the core driver of P/B re-rating. Watch loss cost trends and catastrophe activity as 2026 renewals are negotiated.
- Capital return announcements and reserve releases can accelerate relative performance, but the market appears increasingly selective about balance sheet quality.
- The data set is broad; specialty carriers remain a fertile hunting ground for differentiated underwriting stories.
Data source: Problem of Points P&C Stocks Monitor (Yahoo Finance via Netlify function), pulled on 2026-02-24T14:37:02.477766+00:00 (cache (fallback after Dashboard returned empty company data.)).